Before moving forward, I would like to shout out MichaelHale Ligh for his analysis of Stuxnet using volatility. This post was basically
me trying to learn more about Rekall while trying to retrace Mike's step using Rekall to understand Stuxnet rather than reusing volatility. To get a better understanding of
this post you should probably either review Mike's post first or have it opened
while you go through this one.
I've done a few posts on using various tools for memory
forensics. For example, in this post I used volatility, while in this post I
used Mandiant's memorize. In this post we will now look at Rekall and will use
a memory sample from jonrajewski.com.
The objective here is to learn a bit about Rekall and in doing so let's try
to uncover some of the artifacts that Michael Hale Ligh found in his analysis
of Stuxnet. Note, we are not trying to find all but hoping to learn how to use
Rekall for the basics.
First let's install Rekall on Kali
Following the guidelines from the Rekall manual, let's first
install "virtualenv"
"apt-get install virtualenv"
Now that "virtualenv" is installed, let's continue with the install
"virtualenv /tmp/MyEnv"

 Install the "rekall-gui"
 Note: If during the
installation you get an error relating to “ldcurses” look at the reference
section for a possible solution.
Note: If during the
installation you get an error relating to “ldcurses” look at the reference
section for a possible solution.
Now that we have Rekall properly installed, the first thing
you may want to do is look at the help.
Simply type "rekall -h" 
Rekall Modes

Rekall Modes
Rekall has an interactive mode, a non interactive mode and a
web console. By providing a plugin to the command, we would use the
non-interactive mode. So if you wish to use the interactive mode, only execute
the "rekall" command with the file you would like to analyze.
Let's look at this in practice.
Non-interactive mode:
(rekal) root@securitynik:~/mem_forensics# rekall --filename
stuxnet.vmem pslist

That's it! Just run the "rekall" command with the filename and
a plugin. In the above example we use the "imageinfo" plugin to learn a little bit more about the acquired image. As a
result, we were able to learn that this device image is from a Windows XP
system. We can also tell this system seems to have been up for about 16 hrs (56949
seconds)
Interactive mode
Let's spend the rest of the time looking at this tool in
interactive mode.
To get there all we need is
(rekal) root@securitynik:~/mem_forensics# rekall --filename
stuxnet.vmem

Note above there is no plugin. This drops us into the interactive shell from which we can now work out of.
Let's first take a look at the processes which are running.
[1] stuxnet.vmem 22:56:55> pslist 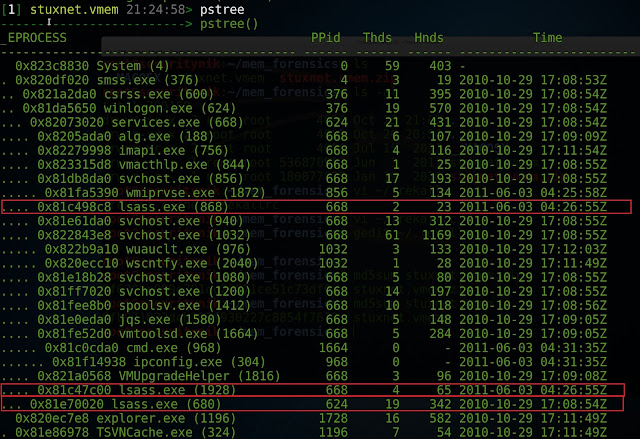
According to Mike, we should be seeing one "lsass.exe" which has a parent of "Winlogon.exe". However, as shown above and as stated by Mike, we have three "lsass.exe" processes. One has a parent of "Winlogon.exe" and the other two have a parent of "services.exe". This means now that we should take a closer look at these 3 processes.

According to Mike, we should be seeing one "lsass.exe" which has a parent of "Winlogon.exe". However, as shown above and as stated by Mike, we have three "lsass.exe" processes. One has a parent of "Winlogon.exe" and the other two have a parent of "services.exe". This means now that we should take a closer look at these 3 processes.
[1] stuxnet.vmem 22:55:58> tokens
proc_regex=("lsass.exe")

Let's move on!
Let's identify the priorities of the 3 "lsass.exe"
processes. To determine this, let's run "[1] stuxnet.vmem 23:00:40>
SELECT _EPROCESS.name, _EPROCESS.pid,_EPROCESS.Pcb.BasePriority FROM pslist(
...: ) WHERE regex_search("lsass.exe",_EPROCESS.name)"

From above we see that the two suspicious entries have a
base priority of 8 while the one we assume is legit has a higher priority of 9.
Continuing to learn about the processes, let's look at the
DLLs they are using.
[1] stuxnet.vmem 19:05:16> dlllist [680,868,1928]

From above, we see the "lsass.exe" (PID 680) having a large
number of DLLs. Note this image only represents a portion of the DLLs associated with this PID.
However, if we look at the two processes of concern PID 868
and PID 1928 we see a fewer amount with PID 868 having the fewest DLLs.


Image of PID 1928 has been truncated. However, the number of DLLs, is still less than that of PID 680.
Something interesting to note about these two PIDs also is
that in both of the "Command Line" arguments, it seems the backlash
(\) is being escaped (\\). This definitely differs from the legitimate entry
with PID 680.
Taking a look at the handles associated with the 3 PIDs
using:
[1] stuxnet.vmem 19:50:33> handles [680,868,1928]


When a look is taken at the handles, we see that PID 680 has a signiicant amount of handles while
868 and 1928 does not have as much. Note the output has been sniped.
Let's now run "malfind" against these PIDs to
see if anything suspicious shows up.
[1] stuxnet.vmem 20:13:01> malfind [680,868,1928]


When the command was run, no results were returned for PID
680 (the process we believe to be legitimate). The same was not true for PIDs
868 and PID 1928
As we can see there seems to be an executable "MZ Signature" starting at offset 0x80000 for both of these PIDs.
Let's use the "ldrmodules" plugin to gain a bit
more insight into the “lsass.exe” process with PID 1928.
[1] stuxnet.vmem 23:46:06> ldrmodules 1928

A quick glance at the image above immediately suggest something
may be wrong and worthy of investigations. Other than the obvious
"red" colour, there are no path information in for these 3 entries.
Also notice that the offset matches those which we identified above using the “malfind”
plugin. This would suggest the dll is probably hidden as it may be unlinked
from one or more lists within the Process Environment Block (PEB).
We see the same thing for the process with PID 868
[1] stuxnet.vmem 09:35:07>ldrmodules 868

stepping back and running the dlllist command again
"[1] stuxnet.vmem 17:10:56> dlllist 1928"
We see the following:
Taking a dump of the 3 "lsass.exe" processes, we see:

Taking a dump of the 3 "lsass.exe" processes, we see:
[1] stuxnet.vmem 17:17:29> procdump [680,868,1928],
dump_dir="./out"

Running "strings" and "grep" against the files which were created to look for the functions Mike mentioned we see
the following:
root@securitynik:~/mem_forensics/out# strings
--print-file-name --data --encoding=s executable.lsass.exe* | grep --perl-regexp
"ZwMapViewOfSection|ZwCreateSection|ZwOpenFile|ZwClose|ZwQueryAttributesFile|ZwQuerySection"

As we can see above, the strings "ZwMapViewOfSection, ZwCreateSection, ZwOpenFile, ZwClose, ZwQueryAttributesFile, ZwQuerySection" are not in the legit lsass (PID 680) but are in the other two. This can be seen from the image above.
Let's verify that "ZWClose" is at
"0x7c90cfd0". To do that let's perform a "dump" of that
memory location.
[1] stuxnet.vmem 22:12:31> dump 0x7c90cfd0

So we see that "ZWClose" is at that memory location. Let's switch context into PID 668 and disassemble the memory location.
Switching context to PID 668
[1] stuxnet.vmem 22:04:52> cc 668

Let's disassemble the memory location.
[1] stuxnet.vmem 22:20:29> dis 0x7c90cfd0

Moving along, disassemble 0x7c900050
[1] stuxnet.vmem 22:26:10> dis 0x7c900050

... and still moving along looking at the call
"0x7c900066"
[1] stuxnet.vmem 22:35:11> dis 0x7c900066, length=1

... and yet another disassembly at "0x009400F2"

....
Filtering for object types "Mutant" in PID 668, we
see the following:
[1] stuxnet.vmem 23:04:33> handles 668,
object_types="Mutant"


Peeking into the registry to look for the MrxNet registry
key
[1] stuxnet.vmem 23:24:33> printkey
'ControlSet001\Services\MrxNet'

And now for the MrxCls key
[1] stuxnet.vmem 23:27:08> printkey
'ControlSet001\Services\MrxCls'


Let's take one more run at the artifacts by looking at the
loaded modules.
[1] stuxnet.vmem 23:39:35> modules

Ok then, if the objective was to learn to use Rekall for memory forensics, I think we have achieved that to some extent. Once again, thanks to Mike for his post on analyzing stuxnet using volatility.
References:
http://www.jonrajewski.com/data/Malware/stuxnet.vmem.zip
http://rekall-forensic.com
https://msdn.microsoft.com/en-us/library/windows/desktop/aa370556(v=vs.85).aspx
https://digital-forensics.sans.org/summit-archives/dfirprague14/Rekall_Memory_Forensics_Michael_Cohen.pdf
http://mnin.blogspot.ca/2011/06/examining-stuxnets-footprint-in-memory.html
http://rekall-forensic.blogspot.ca/2016_07_01_archive.html
https://digital-forensics.sans.org/media/rekall-memory-forensics-cheatsheet.pdf
http://dfrws2016.rekall-forensic.com
Rekall Commands
No comments:
Post a Comment